Our reporting system gives you powerful tools to track, analyze, and share key performance data across your business. Reports are designed to be flexible, customizable, and easy to interpret—so you can get the exact insights you need, when you need them.
Use advanced filters to zero in on the data you want. The table layout allows you to sort columns and group data to customize your view. Save your report settings to easily run whenever needed, or schedule them to run automatically.
- Reports Main Page
- Create a Report
- Save a Report & Schedule Runs
- Add Team Members
- View a Report
- Edit a Report
- Run a Report Again
- Duplicate a Report
- Report Types
Reports Main Page
The Reports main page is the central hub where you’ll find all of your saved, scheduled, and commonly used reports organized in one place. You can start a brand-new report, revisit something you’ve already created, or fine-tune a saved configuration to fit your needs today.
The sidebar makes it easy to jump between different types of reports, while the main content area showcases a full list of all saved reports.
Use filters to search through saved reports. Toggle between “Mine” and “All” views to control whether you see only your reports or all saved reports company-wide. View History to see a complete list of all report runs, including saved reports and one-offs.
Create a Report
From your Reports main page, click New Report and choose the report you want to run. From here, you can create a saved report or a one-off report.
Saved Reports
Saved reports give you more control to name the report, make edits, schedule runs, and share with your team. We recommend using saved reports for data that needs to be pulled on a regular basis.
One-off Reports
One-off reports are for one time use and cannot be edited or run again. To create a one-off report, apply your desired filters and click Run Report. A report name will be auto generated based on the filters used.
Save a Report & Schedule Runs
Saving a report gives you quick access to run it on demand, or you can schedule it to run automatically and share with your team.
Save a Report
To save a report, apply your desired filters and then use Report Details to configure these settings:
- Toggle on Save Report
- Enter a Report Name
- Click Save & Run Report
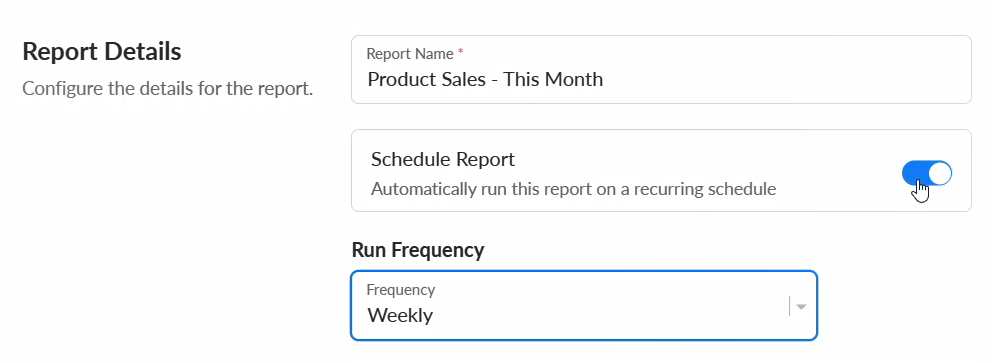
Schedule Runs
You can set up a run schedule when saving a new report or when editing an existing report. Use Report Details to configure these settings:
- Toggle on Schedule Report
- Select a Run Frequency
- Click Save & Run Report
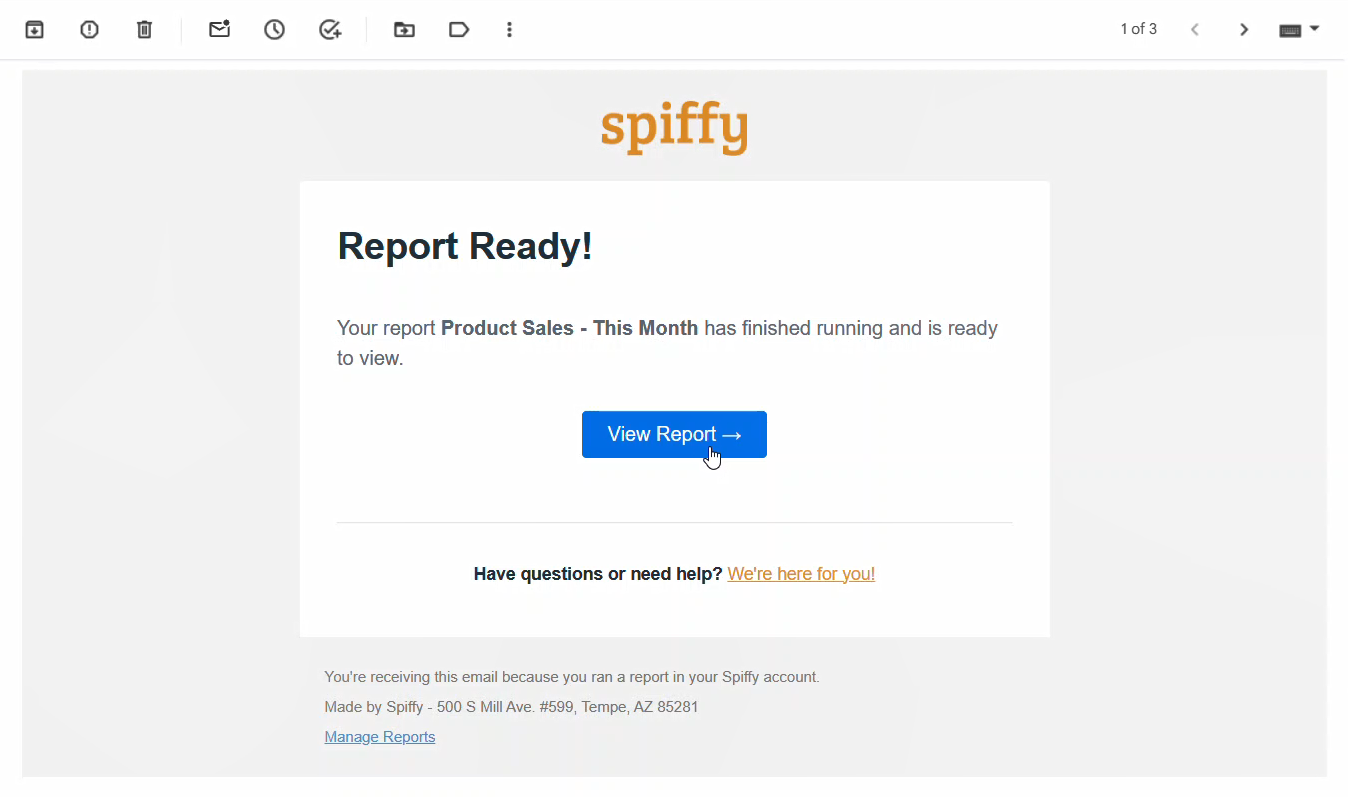
Email Notifications
When you run a new report, you will get an email notification when it’s ready to view. For scheduled reports, you will get an email notification each time a scheduled run occurs. You can also notify specific team members by adding them to the report.
Add Team Members
Adding team members to a saved report allows them to see it on their Reports main page. When a team member is added to a scheduled report, they will automatically receive an email notification every time the report is run.
- Under Report Details, find the Team Members section and select Edit
- To add a team member, find and select them in the drop down list
- To remove a team member, click the red dot next to their name
- Click Done to save your changes
- Once all settings for the report are configured, click Save & Run Report
Note: If you are unable to add a team member, check your Team settings to make sure they have a user role with access to reporting and analytics.
View a Report
When you run a report, it will first display a pending status while the data is being generated. Once the report is ready, the results will appear on the page. You’ll also receive an email notification letting you know it’s available.
Inside the report, you’ll find a variety of tools and components to help you sort, filter, and interpret the data more effectively.
Customizable Table View
Every report begins with a summary of key stats at the top, followed by a detailed table that breaks down your data. Each row in the table reflects results for the selected timeframe, with the ability to dig deeper with Grouping and Columns.
Choose which Columns you want to show or hide, to get a clearer picture of the data you need. You can also break out results by different timeframes within the report’s date range for side-by-side comparisons. Depending on the report type, you can also Group your data to highlight key factors.
Report Insights
Each report comes with built-in insights. This automated analysis helps you interpret the data, identify trends, and find ways to optimize your results. Click Insights to open the side panel and view your insights. Close it to expand the table view of your data.
Report History
For saved reports, you can view a history of previous runs and quickly switch between them to compare data. From inside a saved report, click History. The side panel menu will open showing a list of all runs of the report. Selecting one from the list will switch the current view to that report run for deeper analysis.
Report Details
Inside each report, the Details button will show the state that version of the report was run in, with things like the timestamp it was created, the date range, and applied filters.
Edit a Report
Edit a saved report to change the applied filters, report name, and/or run schedule. From your Reports list, find the report you want to edit. Click on the ellipsis menu (…) and select Edit Report. Alternatively, you can select the Edit button from inside a saved report.
In the popup window, make the desired changes to the Filters and Report Details. The report will run using the new parameters. To run the report now, click Run Report. To save changes without running the report, click Update Report.
Important: Edited filters will only apply to future runs of a report. If you are making significant edits, we highly recommend creating a new report or duplicating a report instead of editing an existing report.
Run a Report Again
Running a report again will give you an updated version of the report, within the selected date range. From your saved reports list, find the report you want to run again. Click on the ellipsis menu (…) and select Run Report.
In the popup window, you can make changes to the filters, or keep everything the same. Click Run Report when finished.
Duplicate a Report
Duplicating a report is a quick way to create a new report by using an existing report as a starting point. If you need to create a report with some of the same filters or criteria as an existing report, this can save time instead of starting from scratch.
In your saved reports list, find the report you want to duplicate, click on the ellipsis menu (…) and select Duplicate. In the popup window, make the desired changes to the applied filters and Report Details, then click Run Report.
Report Types
The features in this article are available for the following reports:
Legacy Reports:
The below reports are on our legacy reporting system and have a different layout for filtering and grouping results: